
�������
ABOUT US
��������硺������˾�Ǹ��¼�����ҵ����2018����ҵȨ�����ų�������������ơ��ٻ�㶫������ҵ��߾�������ҵ20ǿ��һ�������������ٻ��й�������ҵ��߾�������ҵ20ǿ���㶫����ҵ100ǿ��������63λ������ҵ���ǻ��ϵ���רҵ�з�����500kV��220kV��110kV��35kV�����¨������������¡���ѹ���ߵ����Լ�Ԥ��֧���¡����յ��¡������Ե���¡��綯���������¡�70��ʹ�������������ߵȸ������µ���ͷ��ҵ�� ��ϵ�ˣ��־��� ��ϵ�绰��18024068861 ...
������Ѷ
DYNAMIC
������Ѷ
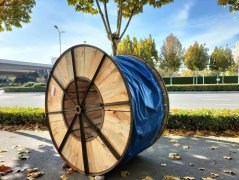
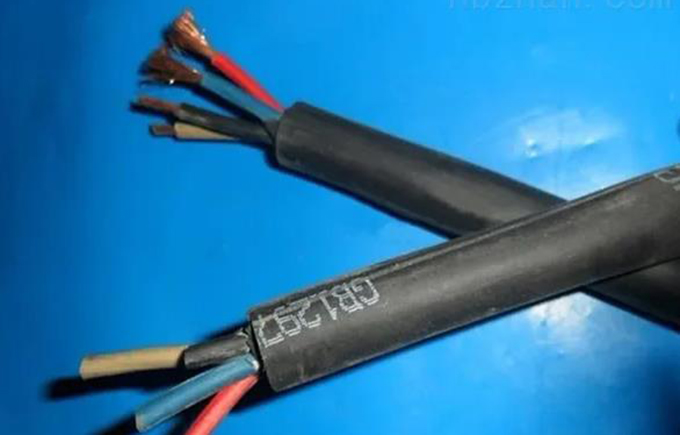
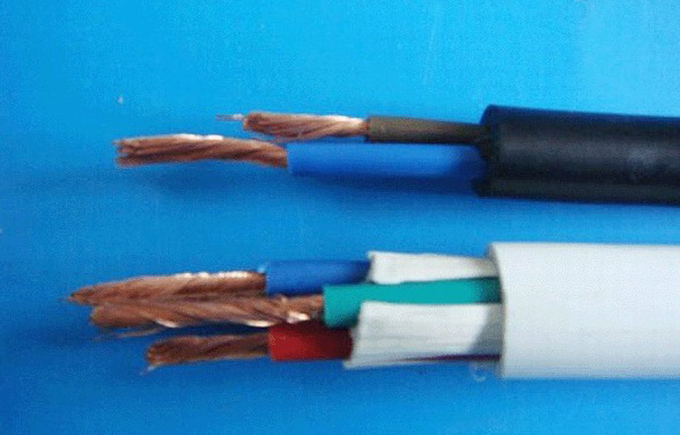
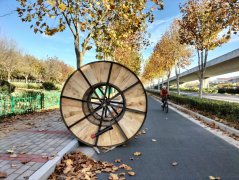
����������ߡ����������¹�����2023-12-31
������������������ߡС��¹����� �������Ƕ����ʨ���Ҫ��Խ��Խ�ߣ����ݡ����ĵ��豸����������Ҳ�������ӣ����������µ�...
������Ѷ
����֪ʶ
DYNAMIC
����֪ʶ
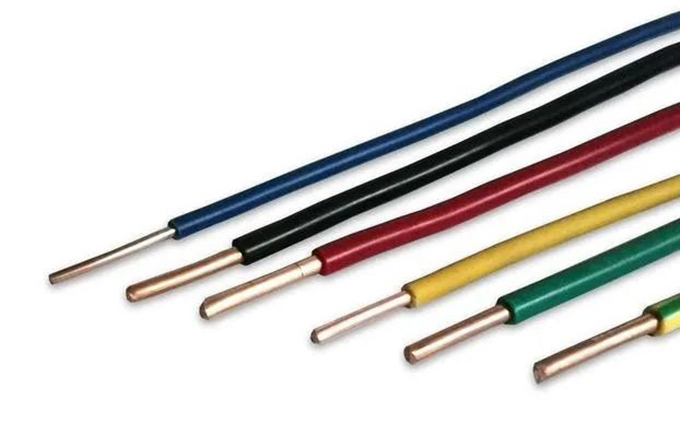
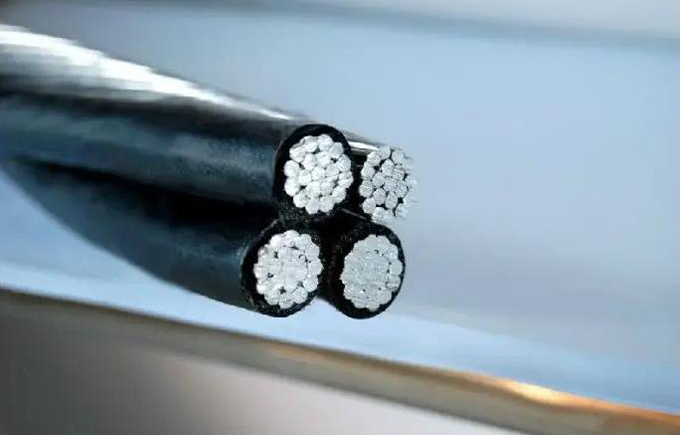
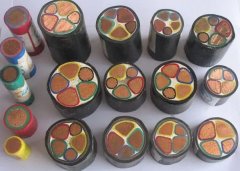
���ߵ���µ���Ҫ���칤�պ�����2023-04-19
���ߵ���µ���Ҫ���칤�պ����� ���ߵ��µ����������������Ʒ��������ʽ����ȫ����ͬ�ġ������Ʒͨ���I���ý�����װ��...